Here is the final installment of this 3 part blog series on bootstrap resampling in SAS Viya’s CAS engine. We look at using this bootstrap resampling functionality in a more creative application. The example from post 2 expands to examine model fit for each bootstrap resample and its relationship to which data points are included or left out of the resample. This constructive idea identifies cases and clusters of cases that are not well explained by the model.
Outline For Blog Series
| Blog Series: Bootstrap Resampling At Scale | |
| Post | Section |
| Post 1 | |
| Post 2 | |
| Post 3 (This One) | |
An Application with Bootstrap Resampling: Slides 11 - 18
Using bootstrap resamples for a more in-depth understanding of the data, including the identification of cases and clusters of cases that are not well represented by the fitted model.
| Slide 11 |
|---|
 |
In this application, we build on the previous example. This slide shows the same code for:
- Create a CAS session
- Create a libname for the CAS session
- Upload the sashelp.heart data to mycas.heart
- Create 1000 bootstrap resample of mycas.heart stored in mycas heart_bs
- run the regression.logistic action with selection criteria and all pairwise interactions included in the model
| Slide 12 |
|---|
 |
Similar to the example, we need to run the final selected model against the full sample data, mycas.heart, and the bootstrap resamples in mycas.heart_bs. This time, we conduct the process in one call to PROC CAS by specifying the model in a variable called “fullmodel” and reusing it in subsequent calls to the regression.logistic for the two datasets. Note that the second call does still use a groupby variable to specify the individual resamples from bootstrapping. This time we are saving the output dataset “FitStatistics” for use in this application.
| Slide 13 |
|---|
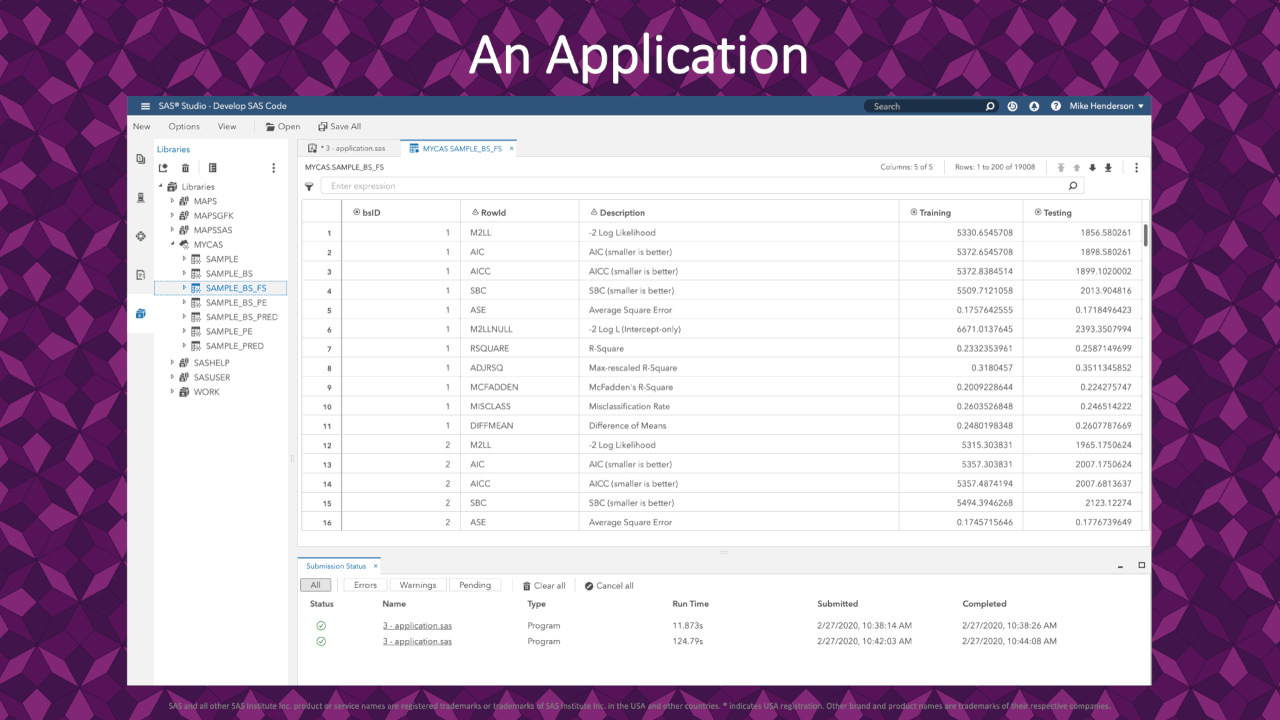 |
In the resulting FitStatistics for the bootstrap resamples, we see 1 row for each measure of fit on each resample. This application uses the -2 Log-Likelihood (rowid = M2LL) for each resample. These values are the response variable in our analysis coming up.
| Slide 14 |
|---|
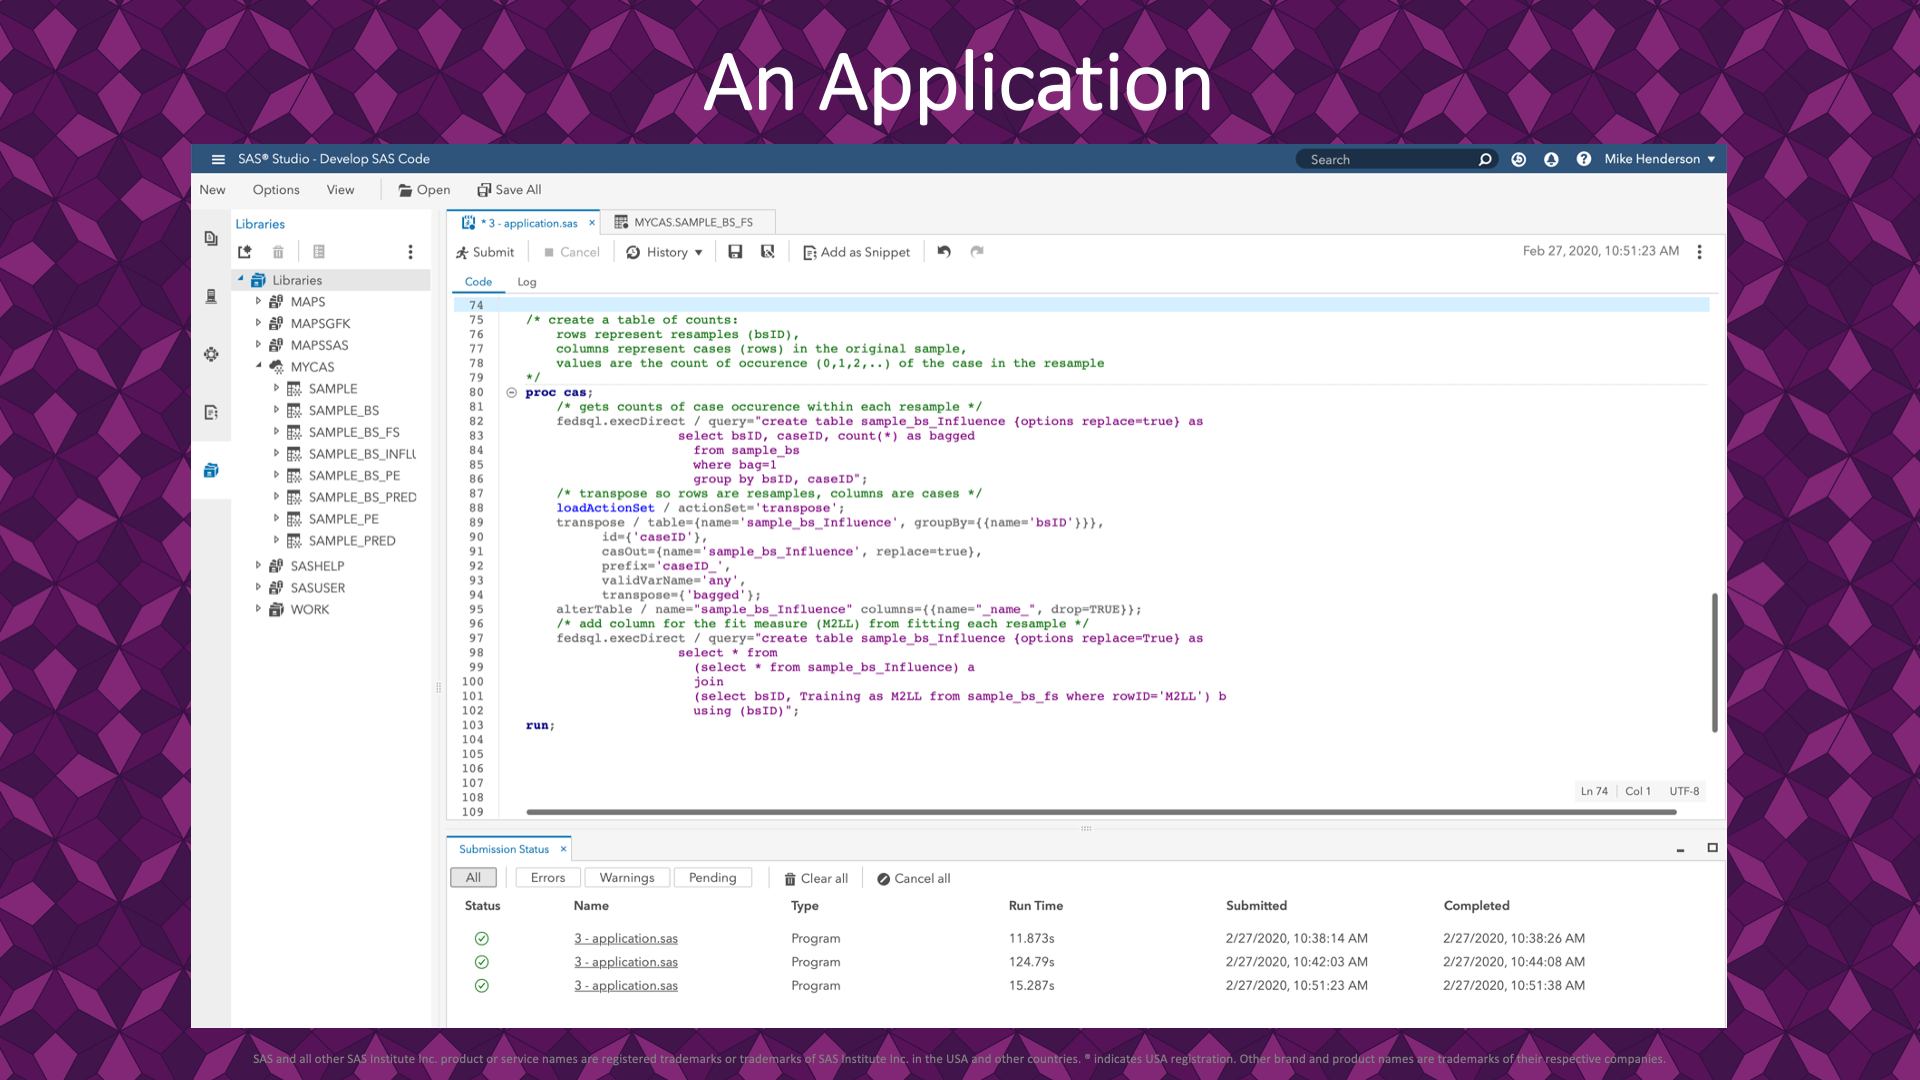 |
The independent variables in our analysis are columns for each row in the original sample study:
- Columns: one for each of the 5209 rows in the sample data (heart)
- Rows: one for each bootstrap resample
- Values: count of how many times the row from the sample showed up in the resample.
The next slide shows a snippet of the resulting data.
| Slide 15 |
|---|
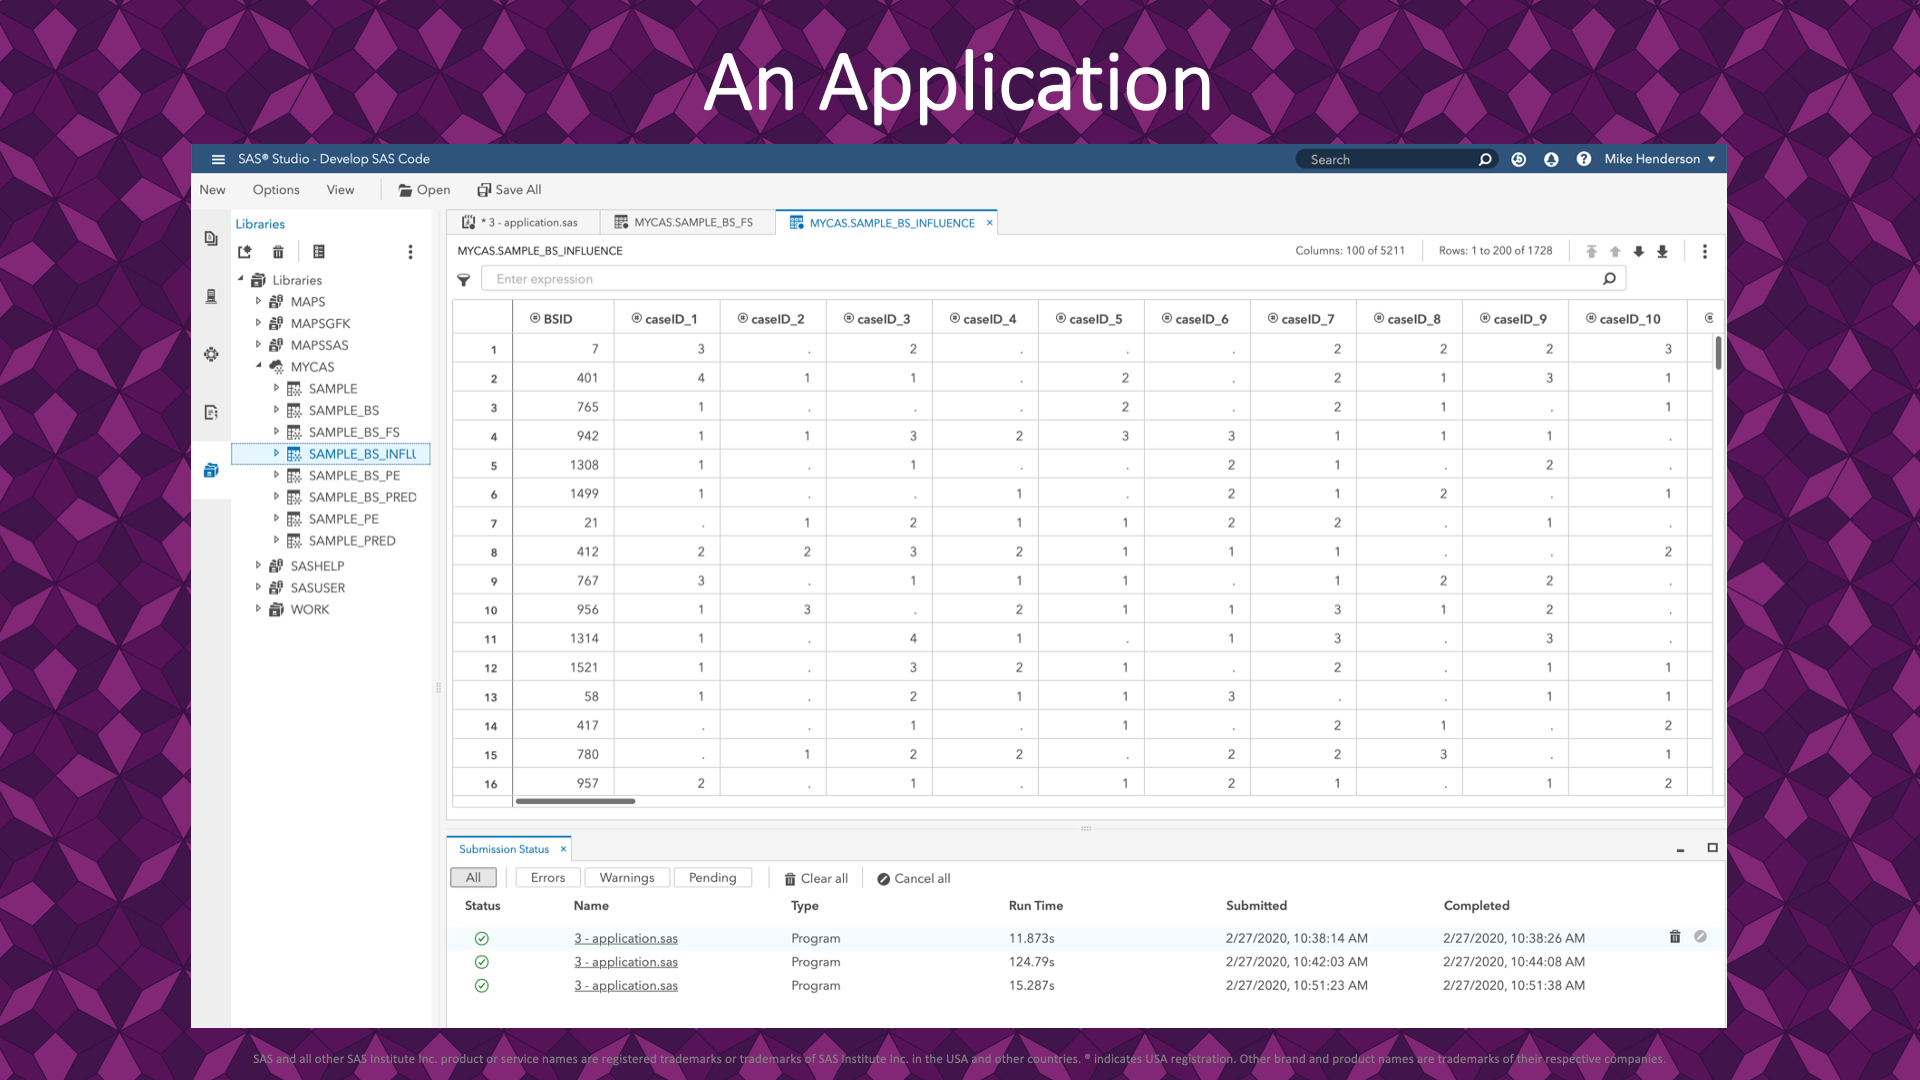 |
The data set created from the code on the previous slide is pictured here. The first rows show that for bootstrap resample number 7, the first row in the sample data (heart) appears 3 times. Also, the 2nd row in the sample data does not get selected in any draws for bootstrap resample number 7.
| Slide 16 |
|---|
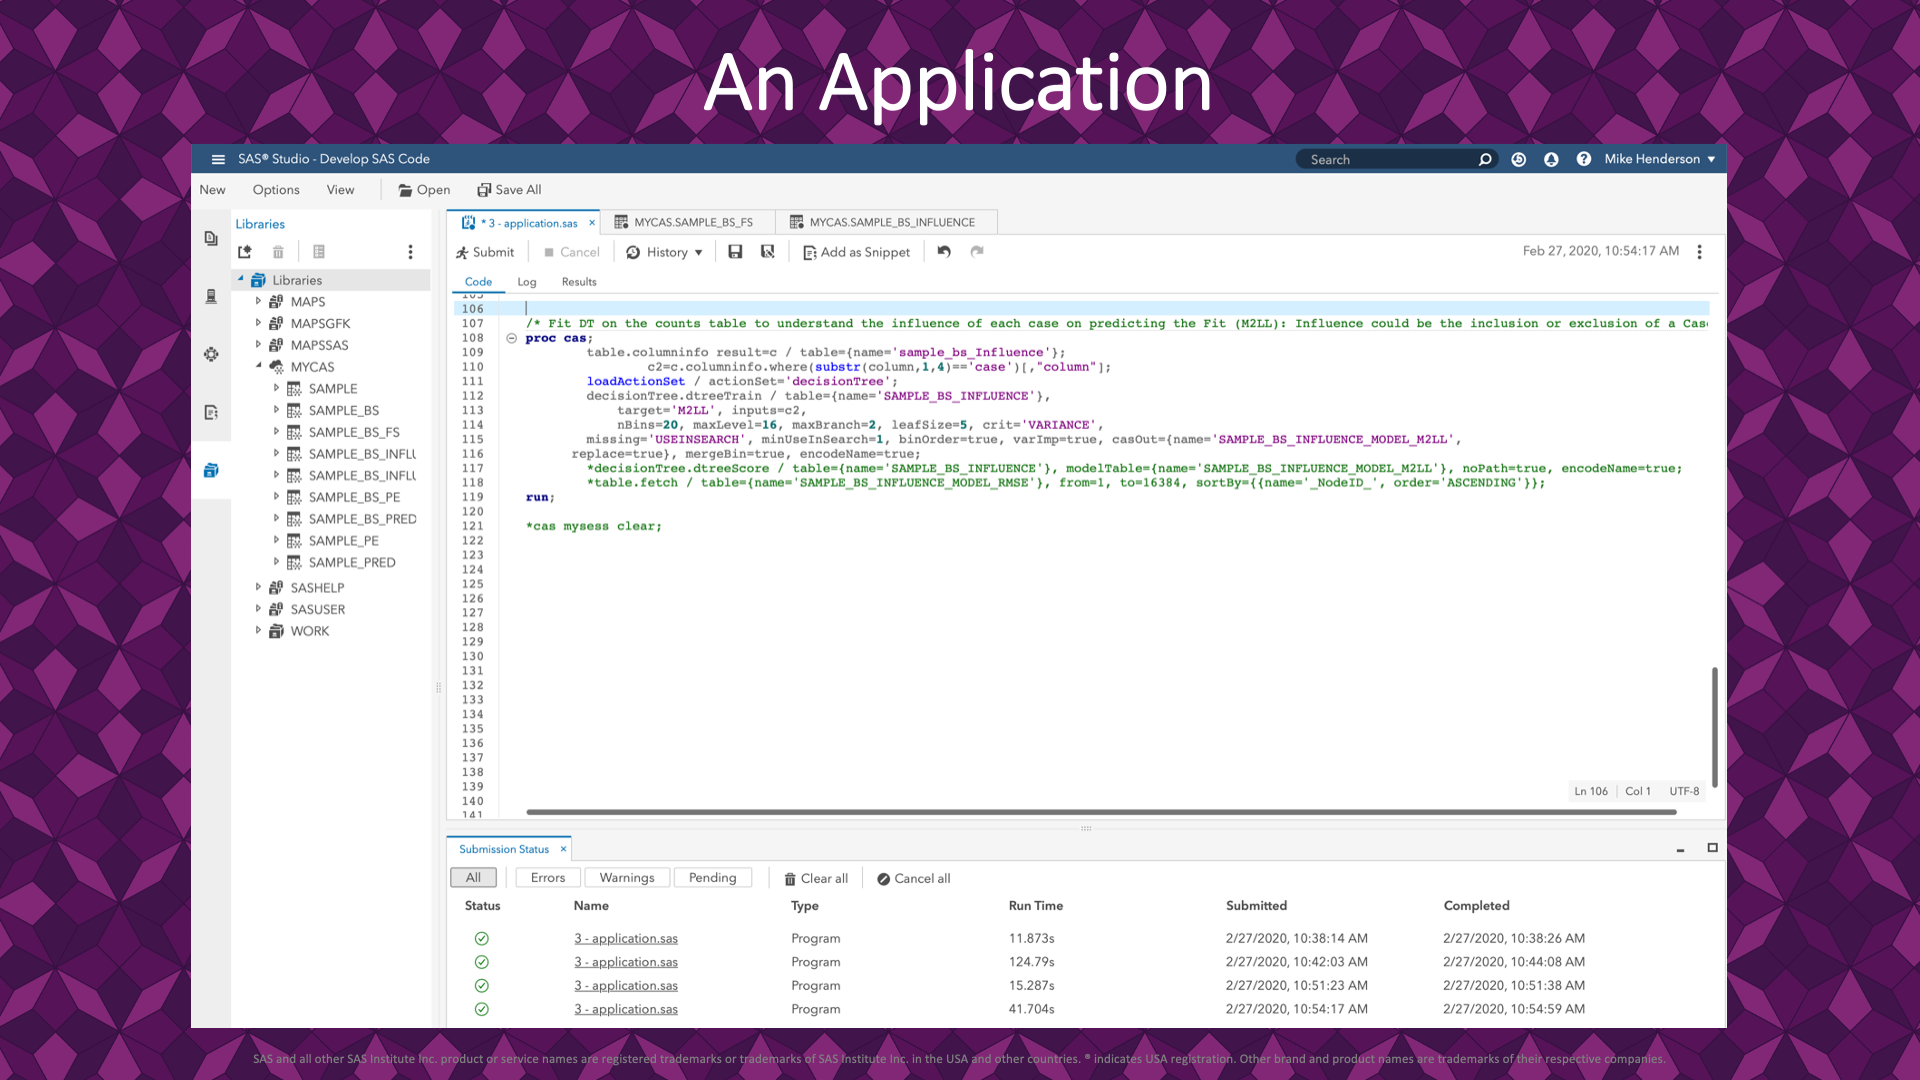 |
Here is the PROC CAS code for building a decision tree for describing the model fit by when rows were present in the resample. The is to understand which rows and combinations of rows are influential in describing the model fit.
| Slide 17 |
|---|
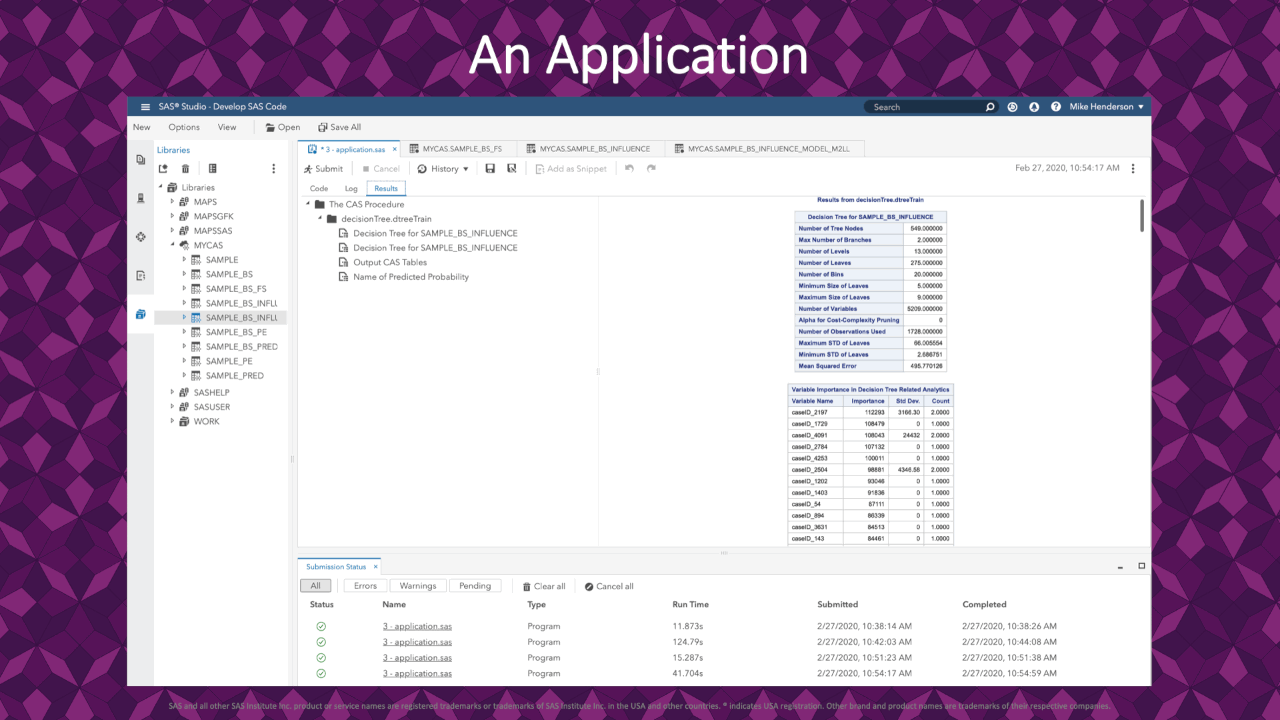 |
A high-level review of the standard decision tree output shows variable importance. Here we see that a few rows appear very influential in describing the fit.
| Slide 18 |
|---|
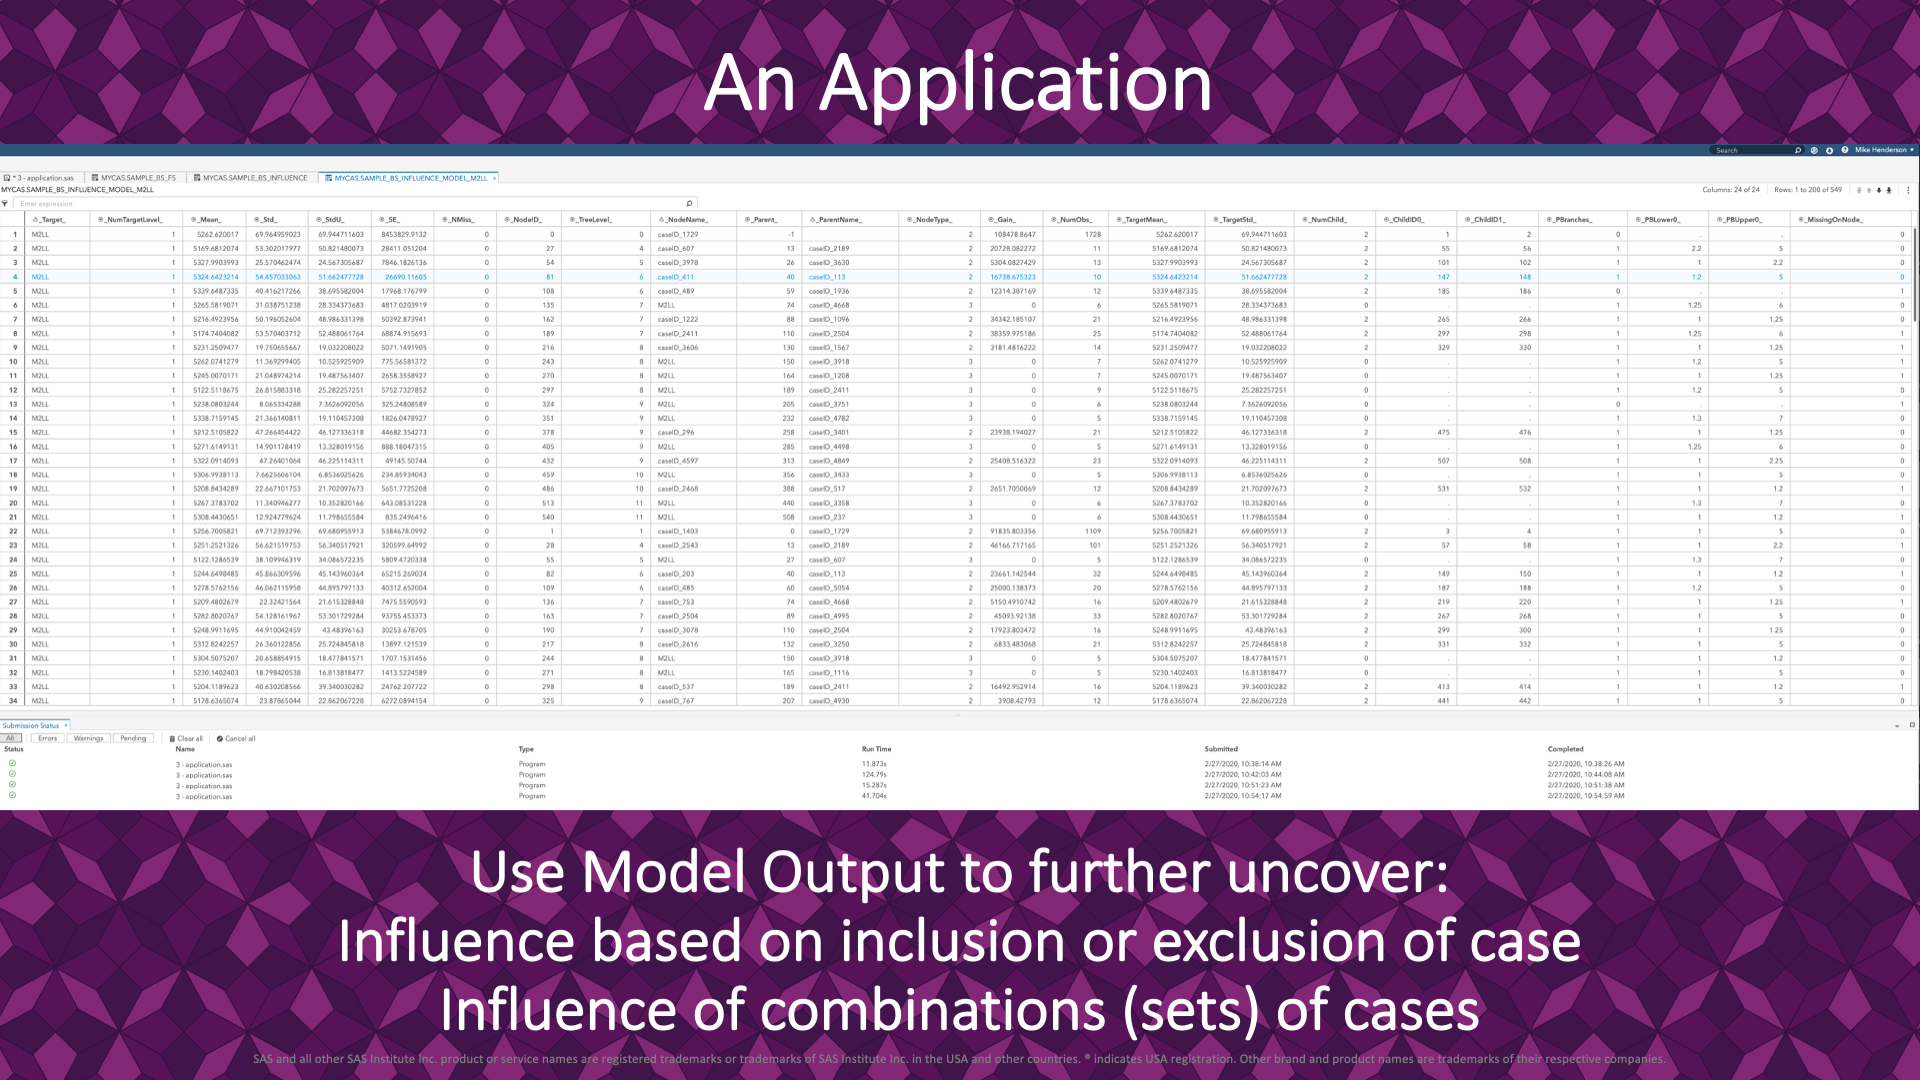 |
When the decision tree trains on slide 16, the tree description saves to an output dataset. On this slide, we can see the level of detail and description of the trained tree. A next step is the examination of this information for the discovery of row clusters that influence the model fit. It can also be interesting to see which rows absence in a resample can influence the level of fit: improvement or degradation. This application makes for a targeted exploration of individual cases that are not well represented by the variables included in our model.
More Details: Slides 19 - 20
A closer look at the features for the bootstrap action as the whole resample action set. Also, a look at other ways to do distributed bootstrap resampling in CAS.
| Slide 19 |
|---|
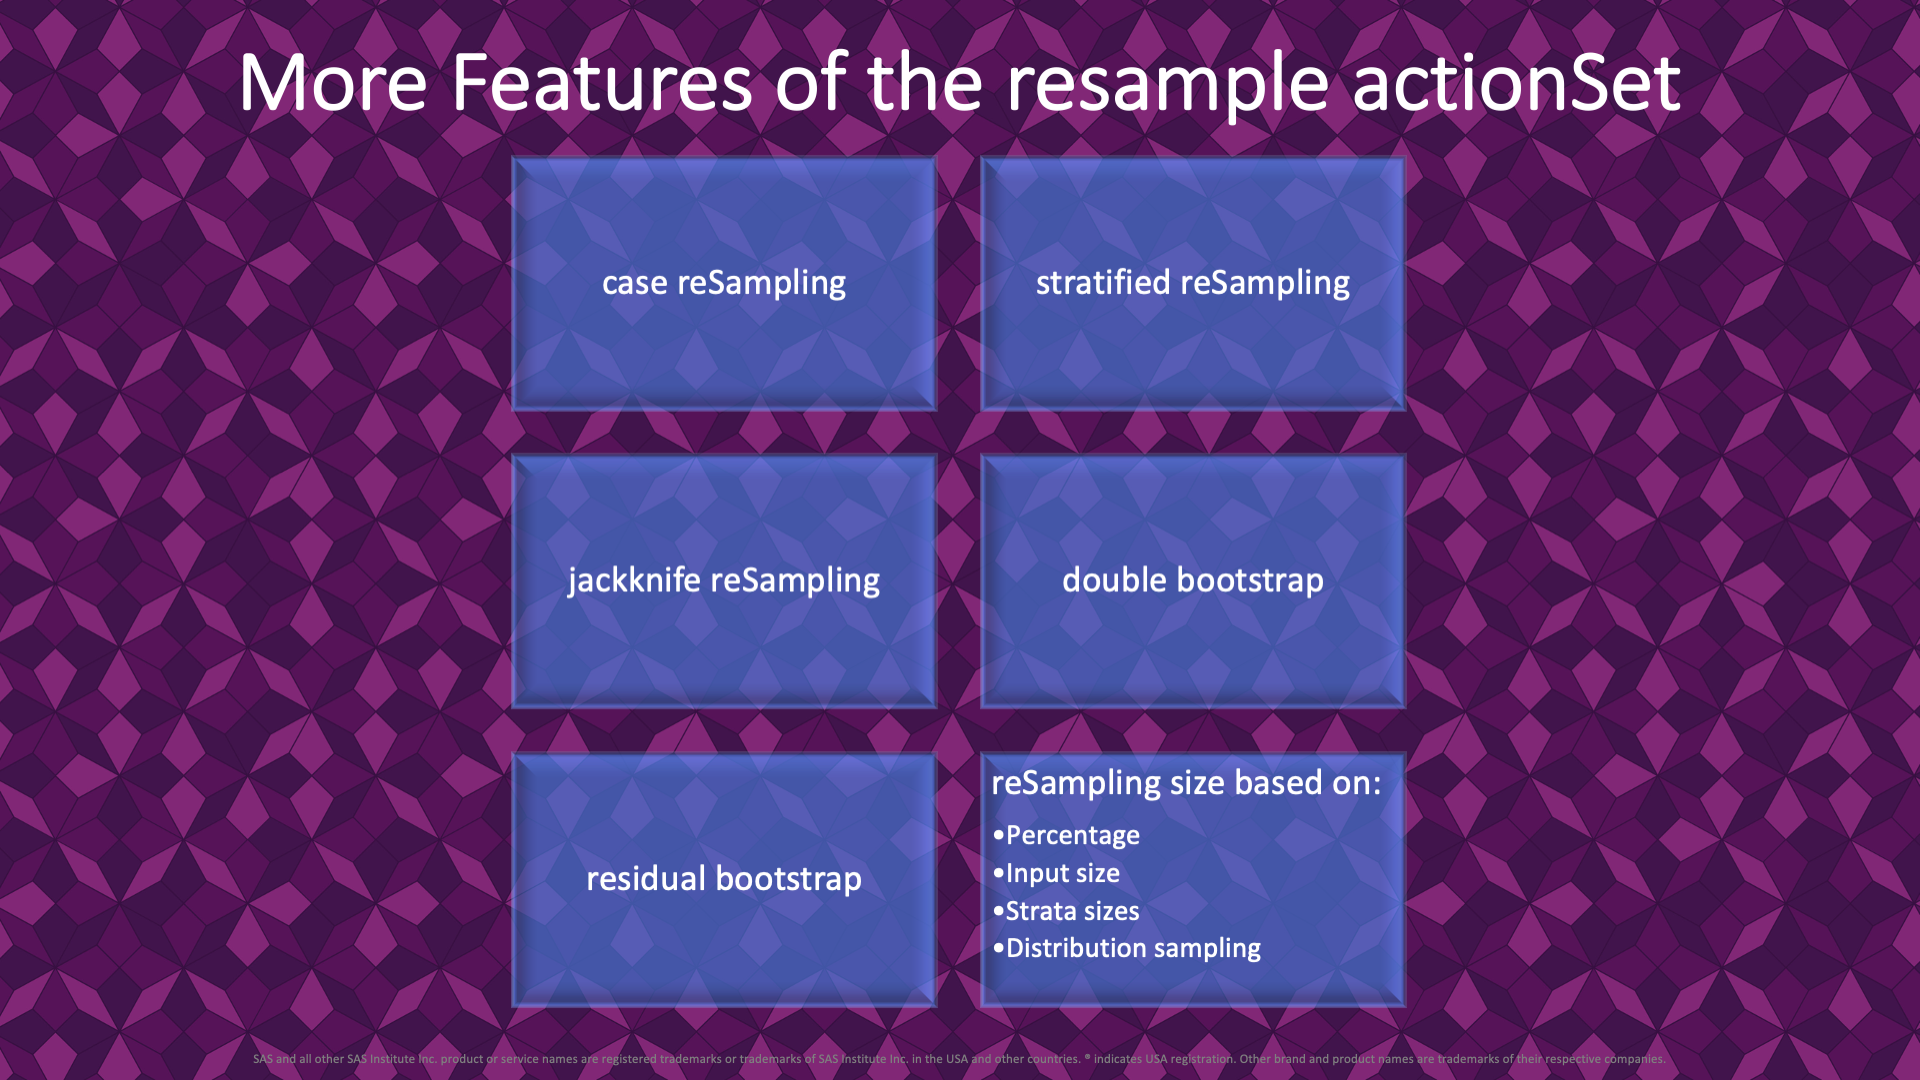 |
In the example and application presented here, the focus has been on simple bootstrap resampling. The resample action set contains many more capabilities, including more complex bootstrap scenarios.
For bootstrap resampling, there are options to resample cases rather than rows and to resample within strata groups. For stratified resampling, there are options to fix the size in each group, use the sample data group size, and even specify a random distribution and parameters to pick sample sizes for each stratum in each bootstrap resample.
Additional actions are available for jackknife resampling and double bootstrap, creating bootstrap resamples for each bootstrap resample.
Many examples are provided for using the actions in different applications. On such example is using these actions to conduct residual bootstrapping.
I invite you to review the detailed documentation on the resample action set GitHub repository and post questions and feature requests as issues in the repository.
| Slide 20 (Click-to-Play) |
|---|
As always, SAS provides more than one way to achieve your data analysis objectives, and SAS Viya is no exception. For users who are familiar with SAS/IML syntax and matrix programming, they find that SAS IML on CAS offers distributed computation with the same syntax they are familiar with is SAS/IML on SAS 9.
The documentation for SAS IML includes an example of residual bootstrapping in CAS.
Post 3 Wrap-up - The End
Thank you for visiting this demonstration in the blog form. I hope that it has been of value to you. I welcome your feedback and engagement on the content and the presentation!