In this post, part 2 of 3, we build on the bootstrap resampling technique presented in part 1 by covering a full example workflow. This workflow illustrates creating percentile confidence intervals for all model parameters and residuals.
Outline For Blog Series
| Blog Series: Bootstrap Resampling At Scale | |
| Post | Section |
| Post 1 | |
| Post 2 (This One) | |
| Post 3 | |
An Example Workflow: Slides 8 - 10
A walkthrough of a typical workflow for using bootstrap resampling in statistical inference.
| Slide 8 |
|---|
 |
The dataset sashelp.heart is epidemiological study data from the Framingham Heart Study (FHS), which began in 1948 and included 5,209 men and women. This slide covers some key details of this data set.
| Slide 9 (Click-to-Play) |
|---|
As a continuation of two slides back, let’s build out an inferential workflow. We have a CAS session, the sample data (sashelp.heart) is loaded (mycas.heart), and the bootstrap action has created mycas.heart_bs with 1000 bootstrap resamples.
This slide (click-to-play) illustrates the steps of a basic inferential workflow.
First, the full data is analyzed with one of the new CAS enable procs, PROC Logselect. This proc is very similar to PROC Logistic but has additional features to take advantage of distributed computing in CAS.
Next, the same work in PROC Logselect triggers using the regression. Logistic action in PROC CAS. The selection method and the model are specified to consider all pairwise interactions, a unique feature of the action.
Following the inference and model selection on the full data, the final selected model is rerun and saved using PROC CAS with the regression. Logistic action and using the output features.
The same model is fitted with nearly identical PROC CAS code to the bootstrap resample in mycas.heart_BS but specifying a groupby variable to indicate the different bootstrap samples (bsID). The parameter estimates from each resample model fit save to an output dataset. The computation distributes since individual computing threads allocate to processors with subsets of resamples.
Wrapping up, another action, resample.percentilePE, is used to calculate the 95% percentile confidence intervals for each parameter across all the resample model fits. PROC SGPLOT is then used to visuall compares the full data parameter estimates with the bootstrap parameter estimates.
We review these results, in detail, on the next slide.
| Slide 10 |
|---|
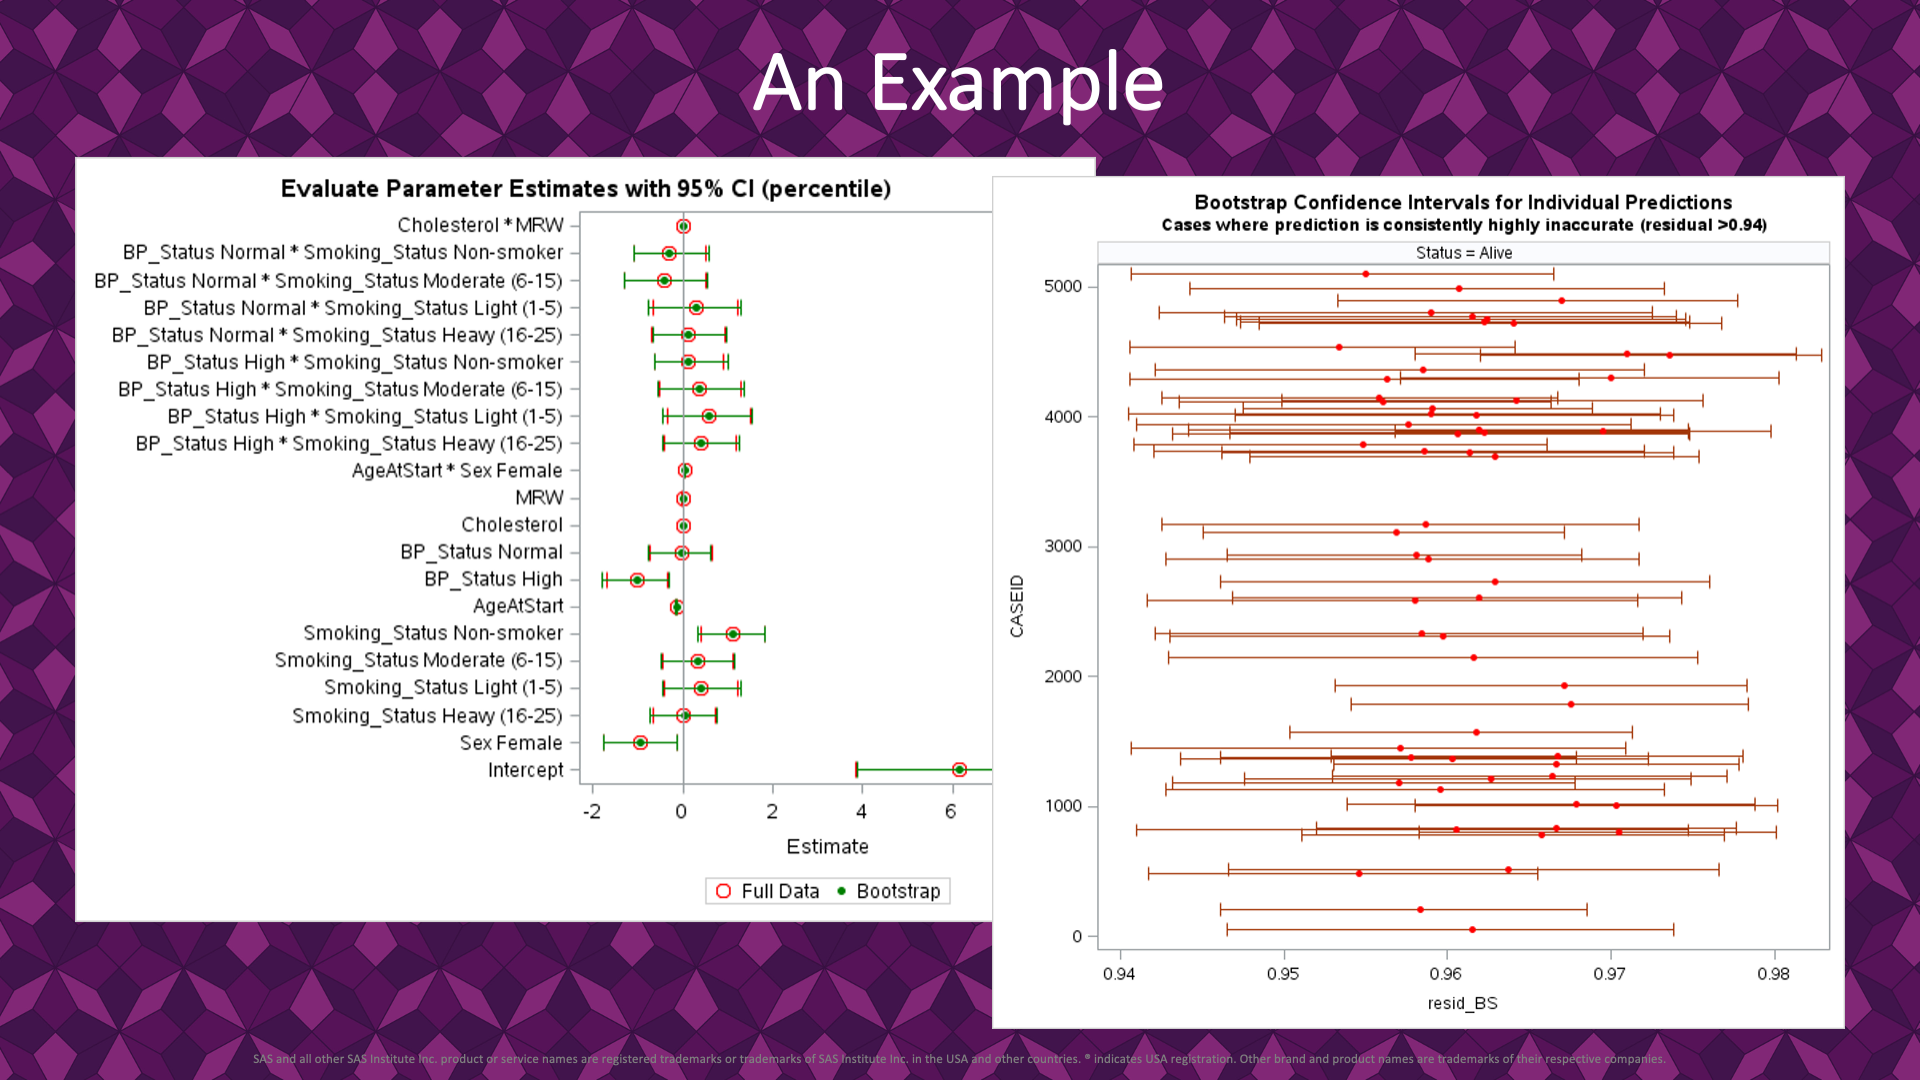 |
A closer review of the results reveals the benefit of the bootstrap approach.
First, on the left, we can see the parameter estimates with two types of confidence intervals: 95% intervals from the model fit and 95% percentile intervals from the fits to bootstrap resamples. For all parameters, the intervals and parameter estimate tightly align, showing how robust the model fit the sample is. In this case, the bootstrap works as a confirmation of our inference from the sample.
Next, on the right, the residual from each bootstrap resample model fit contributes to the construction of 95% percentile intervals for the residuals. This chart shows individual data points with 95% percentile intervals for residuals and filters to just the sample cases with the bootstrap estimate (50th percentile) > 0.94. In this inference, we are explaining status = dead or alive. In all matching cases, the inferred status is that the patient is alive while the residual >0.94 indicates they are dead. These are all cases where the model fit drastically missed the patient’s status and fail to understand why they died. It could be that they died from other causes, and the explanatory variables fail to explain this. In any event, these cases are worth a further review, and the bootstrap percentile intervals helped identify them.
Post 2 Wrap-up
That’s a wrap for post 2! Is this helpful for how you use or want to use bootstrap resampling?
In the next/last post, we look at using this bootstrap resampling functionality in a more creative application. The example for post 2 expands to examine model fit for each bootstrap resample and its relationship to which data points are included or left out of the resample. This is a constructive idea for the identification of cases and clusters of cases that are not well explained by the model.